Storytelling & Case Studies
If we can clearly tie our work to mission outcomes, it helps to gain support for the work at hand and also helps us do more similar work in the future. This is not about just writing it up but doing so in plain language. You know you are effective if you can tell a compelling story to a “lay person” who is not deeply familiar with the technology nor the mission, perhaps your cousin at a family reunion.
Stories can be used to:
- Win new work by painting a vision for what might happen if the customer invests in that area of opportunity. When we tie together the whole story, it demonstrates that we understand their mission and goals, and gets them excited.
- Align a team at the onset of work by providing a shared north-star for what we are trying to achieve. This helps the team be creative and innovate – they can find better ways of achieving the vision only if they understand that vision.
- Support product demos by framing them in the context of the bigger picture story.
- Help our customers shine by having a good story to share with their superiors and stakeholders to show of their work.
- Gain support for future initiatives by establishing credibility. When the customer sees that the team delivers impactful work, that earned trust makes the customer more open to new work proposed by that team.
- Market us for other work by telling the story in proposals and marketing materials. Get prospective customers excited about the potential within their organization by seeing real impacts elsewhere.
The following “SCARF” story format gives a framework for creating small mission case studies. This same format can be used before the fact in order to align the team and stakeholders on the greater vision for a product, feature, or initiative. It can be updated after the fact to share the story and show off the work of the team. This story format can be tailored down to a 3-sentence bullet, or up to a one-pager or 3-5 slide presentation.

For a little more guidance, the following table breaks that down further. You can copy/paste this and replace the “example” column with your story.
| Section | Explanation | Example |
|---|---|---|
| Situation | Describe the greater mission. This is much broader than the problem we are solving but quickly orients the reader with what our customer does in general. | The FDIC ensures safety and soundness in the banking system. |
| For the work we are involved in, what is the more specific background and lay of the land, if not obvious. | Financial bubbles form when the real state of the world is not visible. | |
| What is the specific mission objective our work is trying to meet? (This should not be technical. “Modernizing a system” is not a mission objective.) | By making more and better data available, we may avoid bubbles the major financial and human costs of crashes. | |
| Challenge | What is in the way of achieving that objective? What makes it hard? Why have others failed? Metrics help to paint a picture of scale. | FDIC had many thousands of data points on each of the 5000+ banks they supervise, but it is spread across various source systems, many of which are legacy mainframe technologies. |
| Approach | What did we deliver? What is the solution that meets this need? We can introduce a little bit of technical specifics here, but try to keep it as plain language as possible. | We built BankFind, the FDIC’s first cloud-native system. A flexible data ingest process tied together many sources into a single Elasticsearch index. A machine-readable API enables power users to directly query the data. Modern user interface applications provide seamless access to the data. |
| What did we do, especially things that were novel or non-obvious (i.e., that any other team/contractor wouldn’t have done)? | We worked in a true agile process, delivering a first version in 8 weeks, then incrementally adding features based on user input. Along the way, we reformed various development tools and practices, introducing Git, Docker, and modern local development processes. | |
| Are there screen shots, digestible diagrams, or other visuals that help tell the story? (An AWS architecture diagram won’t do, but a simpler context diagram might.) | 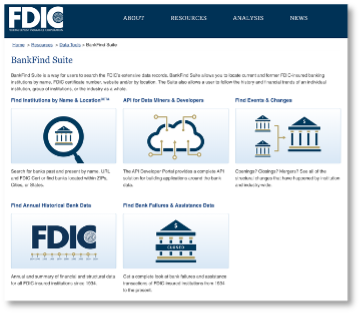 |
|
| Result | How did we move the needle? Talk in terms of mission outcomes (benefit delivered to the public). How do we impact the lives of real people? Metrics help here too. | Bankfind serves over 1 million users a month ranging from the general public, journalists, academics, economists, and bankers – as well as other web applications via the API. |
| Footnotes | You can throw in an addendum of technologies used or other facts and figures. This is not core to the story, but may be insightful to some readers. | The technology stack featured: React, Redux, Node, NestJS, Elasticsearch, S3, and Cloud.gov. The cross-functional team included fullstack developers, a UX designer, an FDIC data SME, and an agile lead. BankFind is available at https://banks.data.fdic.gov/bankfind-suite/ |